All Class III futures prices are above July's prices, ranging in the $16 and $17/cwt. range. Milk priced at $16 to $17/cwt. is not near highs, but is certainly better than the $13 to $15/cwt. range which has existed for most of 2015/16.
The biggest mover was the price of milk protein, up 29.1%. This is a huge increase. What is causing such a huge increase? Milk protein increased from $1.48/lb. to $1.91/lb. The $.43 change is big, but the percentage increase reflects how low the June price of milk protein was at $1.48/lb. The June price was one of the lowest prices for milk protein in 15 years (see chart below). The percentage increase of 29.1% reflects the very low base of the June price.
The price of milk protein is formula dependent on the price of cheese and butter. A higher price for butter reduces the price of milk protein while a higher price for cheese increases the price of milk protein. The logic of this formula is that butterfat carries a different value when used in cheese vs. butter. If the butterfat is more valuable in butter than cheese, it carries a negative value for milk protein. Recently, butter has been near record price levels. The chart below shows the split of butter and cheese pricing on the milk protein pricing.
In July, butter prices were up, but cheese prices were up more, and therefore the relationship of these prices helped create the 29.1% increase in the value of milk protein.
However, the price of Class III milk is still primarily dependent on the butterfat production. As shown in the pie chart below, payment for butterfat is responsible for 60% of the Class III milk price.
The July increases are very positive. The futures prices indicate that many buyers and speculators see this as a lasting higher value. Some of this speculation is based on reduced global production of milk that will improve international prices and thereby improve domestic U.S. milk prices.
The remainder of this post will review the status of domestic inventories that heavily influence domestic milk and component prices, to see if these fundamentals support the July price increases. Production feeds these inventories and will therefore also be reviewed.
The influence of exports, imports, exchange rates and international dairy commodity prices will be reviewed in the next post to this blog.
CHEESE
Because cheese prices are so fundamental to milk pricing, the first commodity to be reviewed will be domestic cheese inventory and production. In summary, inventories are still high and production of new cheese remains robust.
Cheese inventories remain close to 10% above the levels of 2013 and 2015. They are also nearly 20% higher than cheese inventories of 2014, when cheese prices and Class III milk prices were near record levels. This would indicate that the current price increases for cheese do not reflect the persistently high inventory levels.
Production of cheese also remains robust compared to prior years with June production of cheese continuing at the year end levels of 2015 and YTD 2016. This production level would indicate that cheese inventories will probably not decline in the near future.
There are three other dairy commodities that are used to price producer milk. They are butter, nonfat dry milk, and dry whey.
BUTTER
The inventories of butter have not changed in the June ending inventories. Nevertheless, butter prices increased by 7.1%, which has to be based on something other than inventory levels.
Butter production has also remained at levels slightly above prior years, so this would indicate continuing high butter inventory levels. International prices for butter remain well below U.S. domestic butter prices.
Wholesale butter prices are used to set the value of butterfat.
NONFAT DRY MILK
Nonfat dry milk is largely an export item and domestic prices reflect the competitive international prices. Inventories for 2016 remain at constant levels, but pricing is largely dependent on international prices.
The international price may justify the 6% increase in July's NASS pricing. International prices will be covered in the next post to this blog.
Nonfat dry milk is the basis for pricing Class II and Class IV milk and may be used for Class I pricing.
DRY WHEY
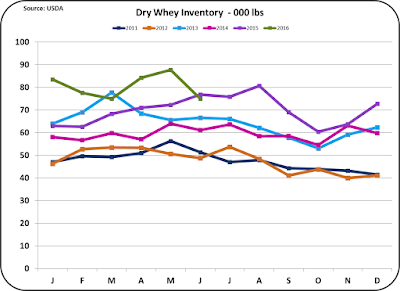
Dry whey is the final commodity to be reviewed. Dry whey inventories do not fluctuate as much as some other dairy commodities, because whey is dried to fulfill standard inventory levels. Wet whey is sold for other uses at lower prices. Dry whey is also a major export item.
Nothing in the dry whey inventories substantiates the 5.4% increase in July prices. However, international prices play a large part in pricing dry whey. Dry whey pricing is used to set the price of "other solids" in the Federal Order component system.
In summary, the price increases seen in July for all dairy products, are not substantiated by the current domestic inventory data available. In the next post, new international data will be reviewed to see if this data supports the July increases.


No comments:
Post a Comment